RFC 2544
The RFC 2544 plugin benchmarks a network device under test (DUT) using the RFC 2544 methodologies: zero-loss throughput, frame loss at different loads, forwarding latency, the longest loss-free frame burst (back-to-back), recovery after overload, and recovery after a DUT reset. The test runs as a series of trials: for each frame size the agent selects the offered load itself, validates every trial, and saves the results.
The plugin belongs to the Network Testing module (see Pricing) and is configured in the Data Plane: click Add plugin, find RFC 2544 in the catalog, and open the RFC parameters section. Switch methodologies (MAC table, broadcast, congestion) are described in RFC 2889.
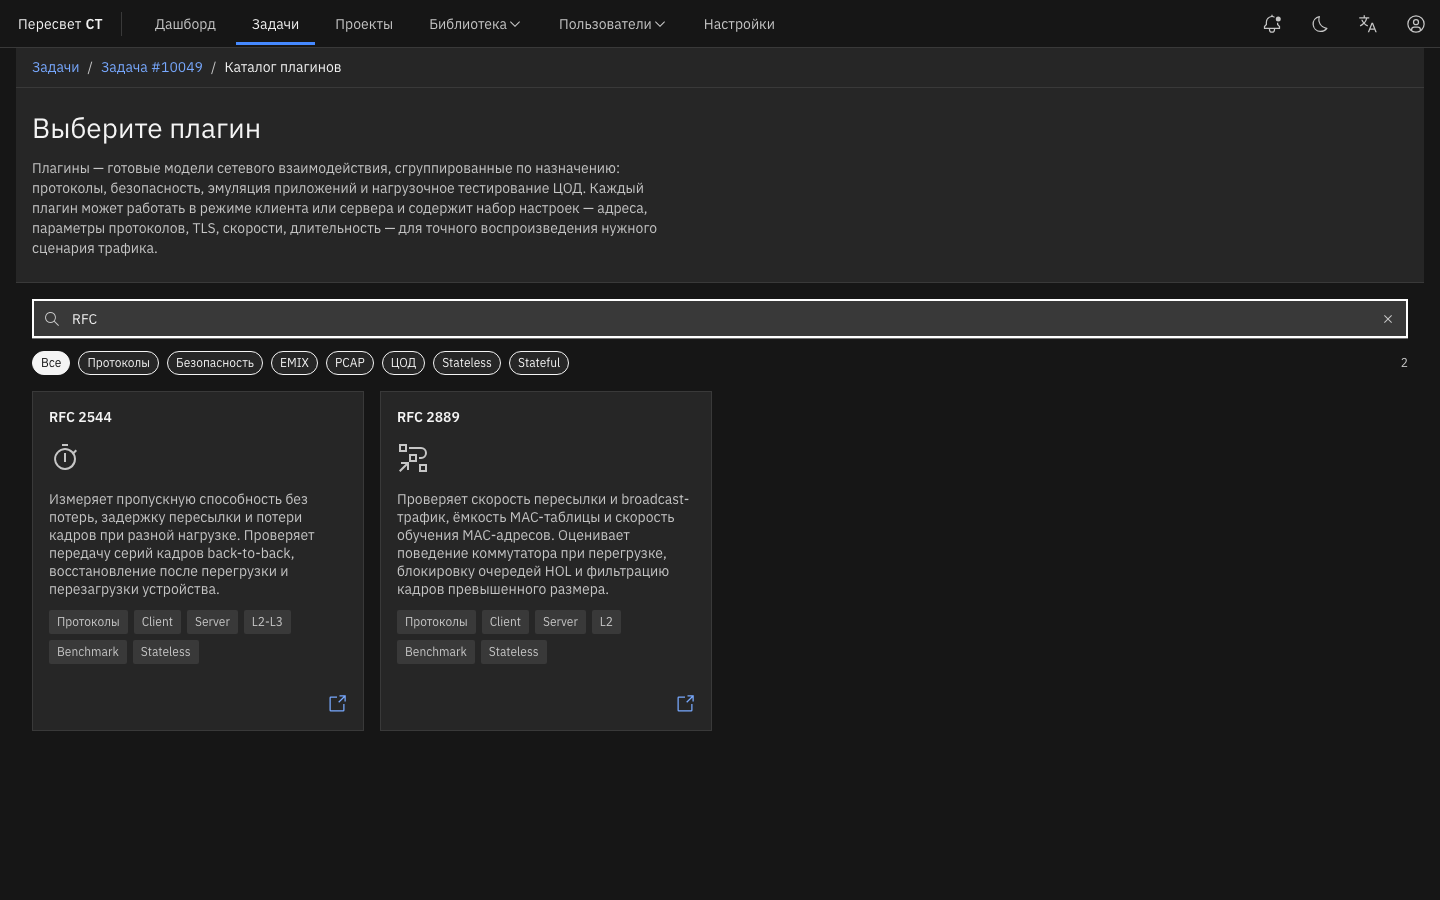
Figure 21a — RFC 2544 and RFC 2889 in the plugin catalog (search for "RFC")
Test Setup
An RFC series is a separate task. It contains one RFC 2544 client entry and one or more RFC 2544 server entries; other plugins, the Control Plane, Access Groups, and packet capture are not used in such a task.
- Add an RFC 2544 client entry. Under Sources, select the transmitting interfaces and their networks.
- Add an RFC 2544 server entry (see RFC 2544 (server)). Under Traffic recipients, select the receiving interfaces and their networks.
- Under Targets of the client entry, select the networks of the server entry. Every target network must belong to a receiving interface of the task, and vice versa.
- Configure the methodologies, frame sizes, and trials in the RFC parameters section of the client entry. In the server entry, this section only sets the speed of its ports.
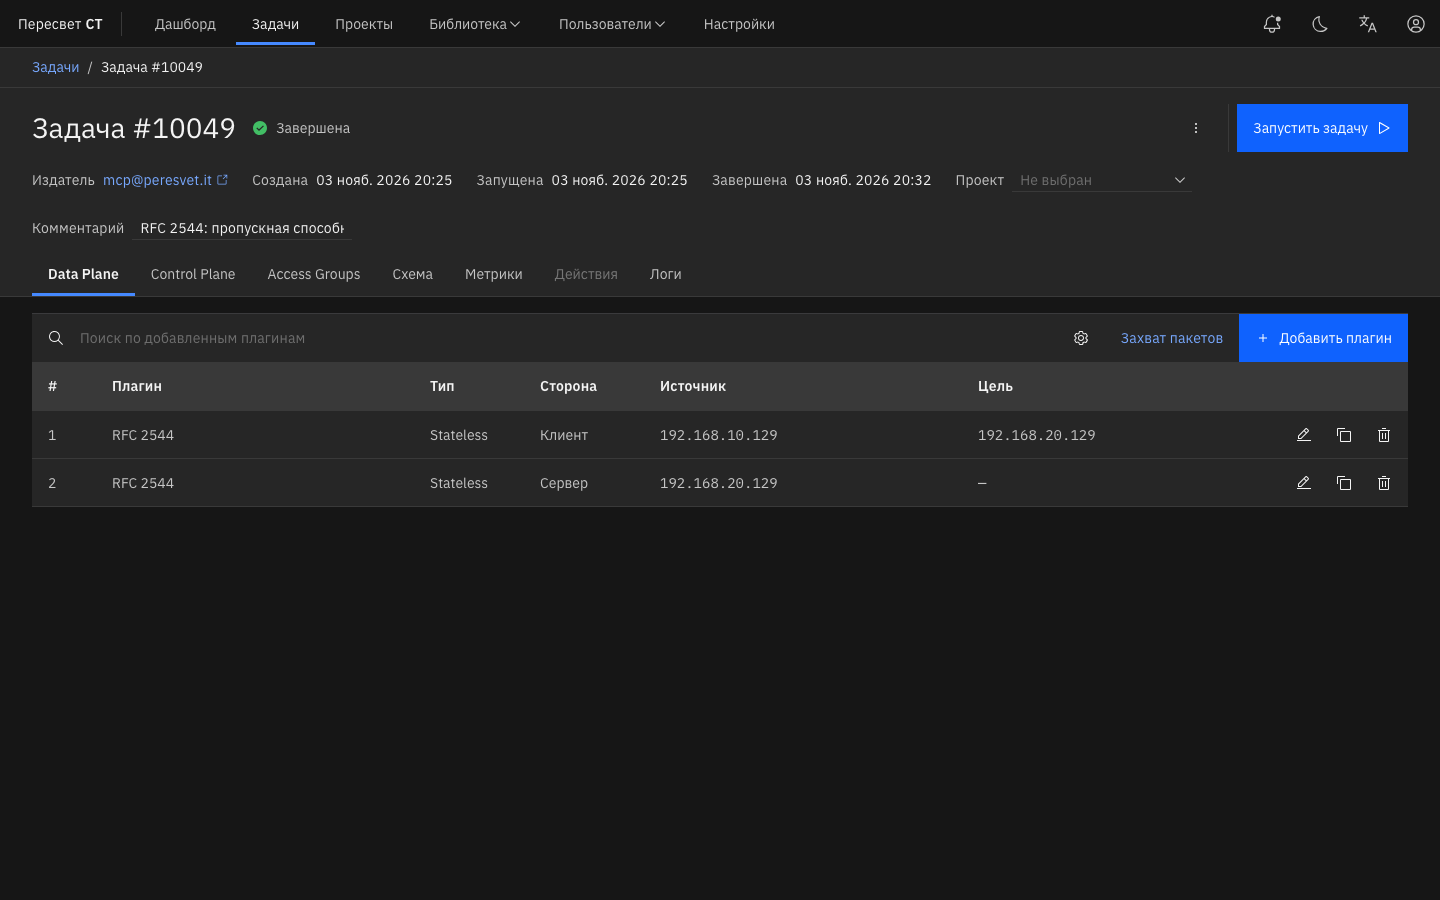
Figure 21b — An RFC 2544 task: the client entry transmits, the server entry receives
Port and network requirements:
- A series uses 2 to 8 ports; each port is a separate agent and interface pair.
- The port link must be up, its speed must be detected by the agent, and it must run in full duplex. Otherwise, the Ports section shows an error.
- Networks are fixed and have no network tunnels. A port network can contain up to 256 addresses: throughput and frame loss build streams across all addresses of the network. Latency, back-to-back, Recovery, and Reset require a network with one address and one source port.
- The Transmit in both directions checkbox adds reverse traffic: every port transmits and receives at the same time. It is available for all methodologies except Reset.
Latency can be measured only if all participating ports are on the same agent: ports on different agents have no common clock. The other methodologies also work across agents.
Methodologies
| Methodology | What is measured | How it runs | Result |
|---|---|---|---|
| Zero-loss throughput (RFC 2544, section 26.1) | The highest load at which the DUT forwards every frame | The first trial runs at the Maximum port load. If there is no loss, the search ends. Otherwise, a binary search runs between 0 and the maximum load until the gap between the bounds is no larger than the Search resolution | Load in % of the port speed |
| Frame loss at varying load (section 26.3) | The share of lost frames at different loads | From the maximum load downwards in steps of the Load reduction step, until two consecutive trials pass without loss | Loss in % at each load |
| Forwarding latency (section 26.2) | The time from transmitting a frame to receiving it | At the measured throughput, trials of the latency Trial duration, at least 20 repetitions | Mean, minimum, and maximum in µs for each direction |
| Back-to-back (section 26.4) | The longest burst at line rate that the DUT forwards without loss | Bursts at 100% of the port speed; binary search of the burst length up to the Maximum burst time, then independent search repetitions | Burst length in frames, mean and standard deviation across repetitions |
| Recovery after overload (Recovery, section 26.5) | How long the DUT takes to return to loss-free reception after an overload | Overload at 110% of the measured throughput (no more than 100%) for the Overload period, then the rate is halved; recovery is confirmed by continuous loss-free reception | Recovery time in µs |
| Reset — manual DUT reboot (section 26.6) | The forwarding interruption during a DUT reboot | One stream of 64-byte frames at the measured throughput; the operator reboots the DUT when prompted in the UI | Duration of the reception gap in µs |
Throughput is measured first for each frame size. If latency, back-to-back, Recovery, or Reset is selected, throughput is added to the series automatically: these methodologies use the load it finds. If no zero-loss point is found, the dependent methodologies are not run.
Back-to-back and Recovery are skipped if throughput is 100%: with a single ingress port the DUT cannot be overloaded. The report shows an explanation such as "Back-to-back skipped: throughput reached line rate, overload through a single ingress is impossible".
Reset can only be selected on its own, uses 64-byte frames and one pair of ports. One run performs one reboot.
Parameters
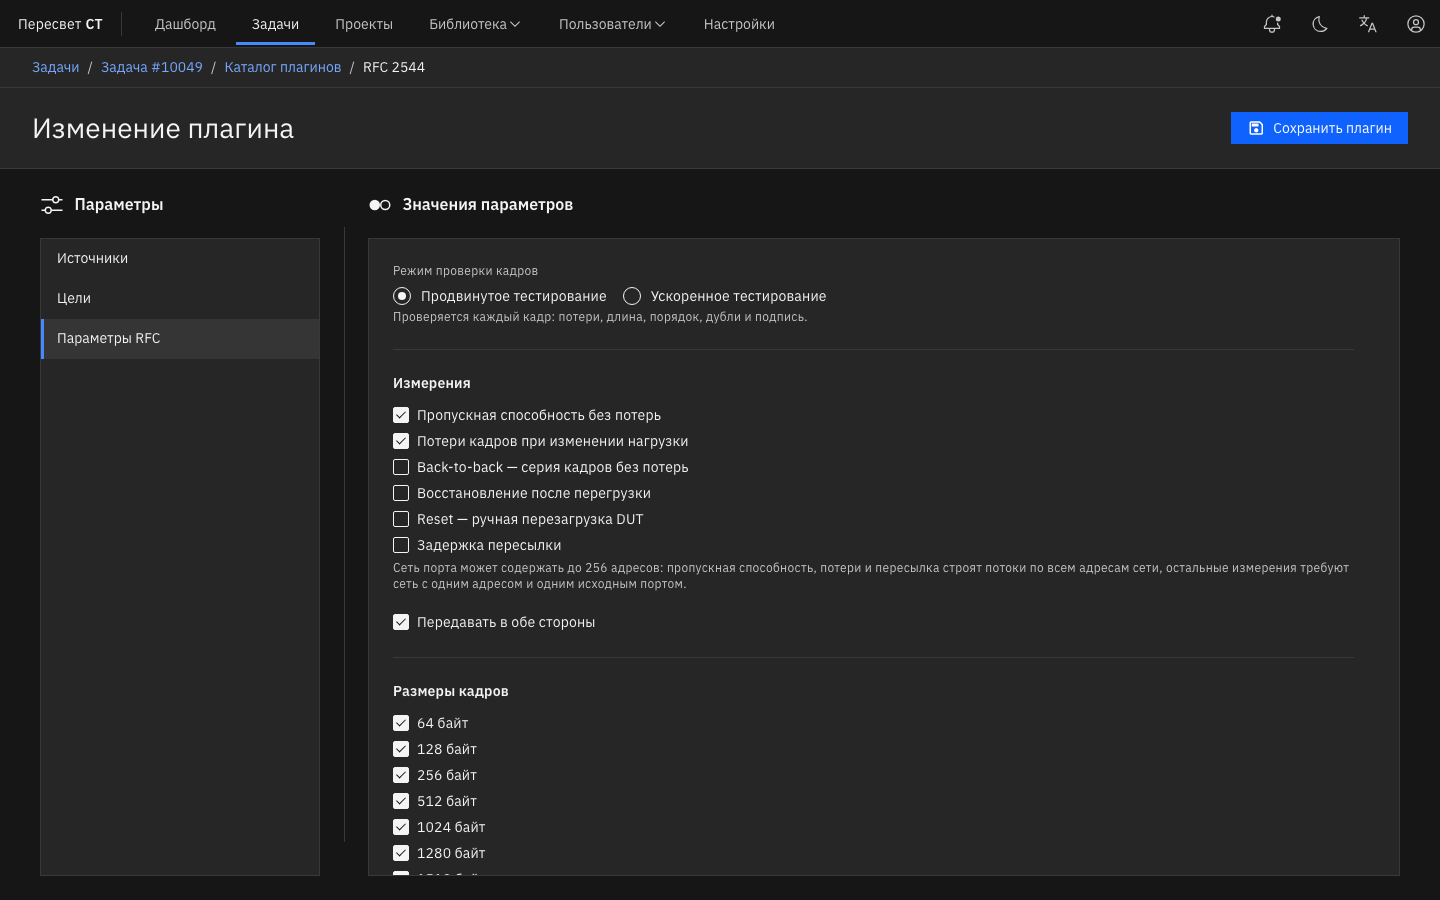
Figure 21c — The "RFC parameters" section: frame check mode, measurements, and frame sizes
Frame check mode
| Mode | What is checked |
|---|---|
| Advanced testing (default) | Every received frame: loss, length, order, duplicates, and the test frame signature |
| Accelerated testing | The network card counts test frames per port, and the CPU checks a 1/64 sample. Tester performance is higher, but Recovery and Reset are unavailable, and order, duplicates, and signature are checked only on the sample |
In accelerated mode, if one port receives several streams, the per-stream values are a proportional estimate based on the port counter; the report says so.
Frame sizes
The frame size includes the Ethernet header and the FCS. The preset sizes are 64, 128, 256, 512, 1024, 1280, 1518, 9000, and 9018 bytes; 64–1518 are selected by default. The Additional size field adds a custom size from 64 to 9018 bytes; a series can have up to 64 sizes. Reset uses only 64 bytes.
Frames larger than 1518 bytes (jumbo frames) must be supported along the whole test path: on the DUT ports and on any switches between the tester and the DUT.
Trial settings
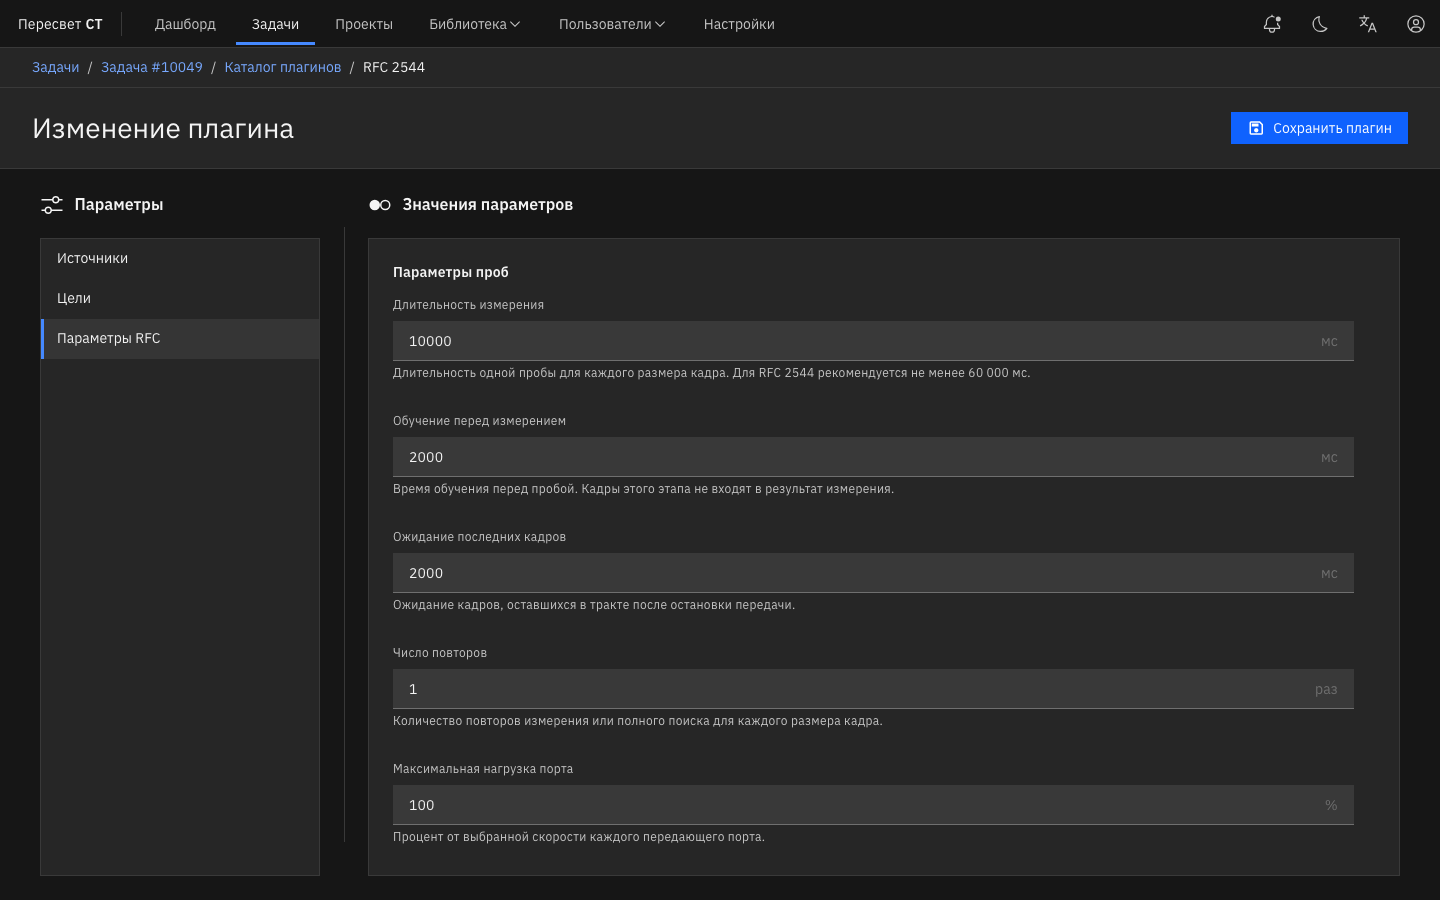
Figure 21d — Trial settings
| Parameter | Description | Value |
|---|---|---|
| Measurement duration | Duration of one trial. RFC 2544 recommends at least 60 s; with a shorter value the results note a methodology limitation | 1000 to 3,600,000 ms, default 60,000 ms |
| Learning before measurement | Frames sent before the trial so that the DUT learns the addresses. Frames from this stage are not included in the result | 1000 to 60,000 ms, default 2000 ms |
| Wait for last frames | Reception continues after transmission stops to account for frames still in the path | 100 to 60,000 ms, default 2000 ms |
| Number of repetitions | How many times to repeat the measurement or the full search for each frame size | 1 to 100, default 1 |
| Maximum port load | Upper load bound in % of the speed of each transmitting port. If back-to-back, Recovery, or Reset is selected, the field is unavailable and equals 100%: these methodologies set the load themselves | 0.1 to 100%, default 100% |
| Search resolution | The throughput search ends when the gap between the bounds is no larger than this value | 0.001 to 10 percentage points, default 0.1 |
| Load reduction step | Step between trials of the frame loss methodology | 0.1 to 10 percentage points, default 10 |
| Generator rate tolerance | A trial is invalid if the actual transmit rate differs from the requested rate by more than the tolerance | 0.01 to 5%, default 1% |
Methodology settings
These blocks appear only when the corresponding methodology is selected.
| Block | Parameter | Value |
|---|---|---|
| Back-to-back | Maximum burst time: the longest duration of one burst at the port speed | 2000 to 60,000 ms, default 2000 ms |
| Burst resolution: the gap between the search bounds at which the search ends | 1 to 1,000,000 frames, default 1 | |
| Independent search repetitions | 1 to 100, default 50 (at least 50 is recommended) | |
| Recovery | Overload period | 60,000 to 1,800,000 ms, default 60,000 ms |
| Recovery observation: how long to wait for recovery after the load is reduced | 1000 to 1,800,000 ms, default 60,000 ms | |
| Loss-free interval: continuous loss-free reception that confirms recovery | 100 ms up to the observation value, default 1000 ms | |
| Recovery repetitions | 1 to 100, default 5 | |
| Latency | Trial duration | 120,000 to 3,600,000 ms, default 120,000 ms |
| Latency repetitions | 20 to 100, default 20 | |
| Reset | DUT reset type: software reboot, hardware reset, or power off for 10 seconds | Software reboot by default |
| Observation window: time for the DUT reboot and for reception to recover | 30,000 to 3,600,000 ms, default 300,000 ms | |
| Minimum gap: reception gaps shorter than this value are ignored | 1 to 1000 ms, default 100 ms | |
| Stable reception: continuous reception before and after the reboot that confirms readiness and recovery | 1000 to 60,000 ms, default 1000 ms |
Ports
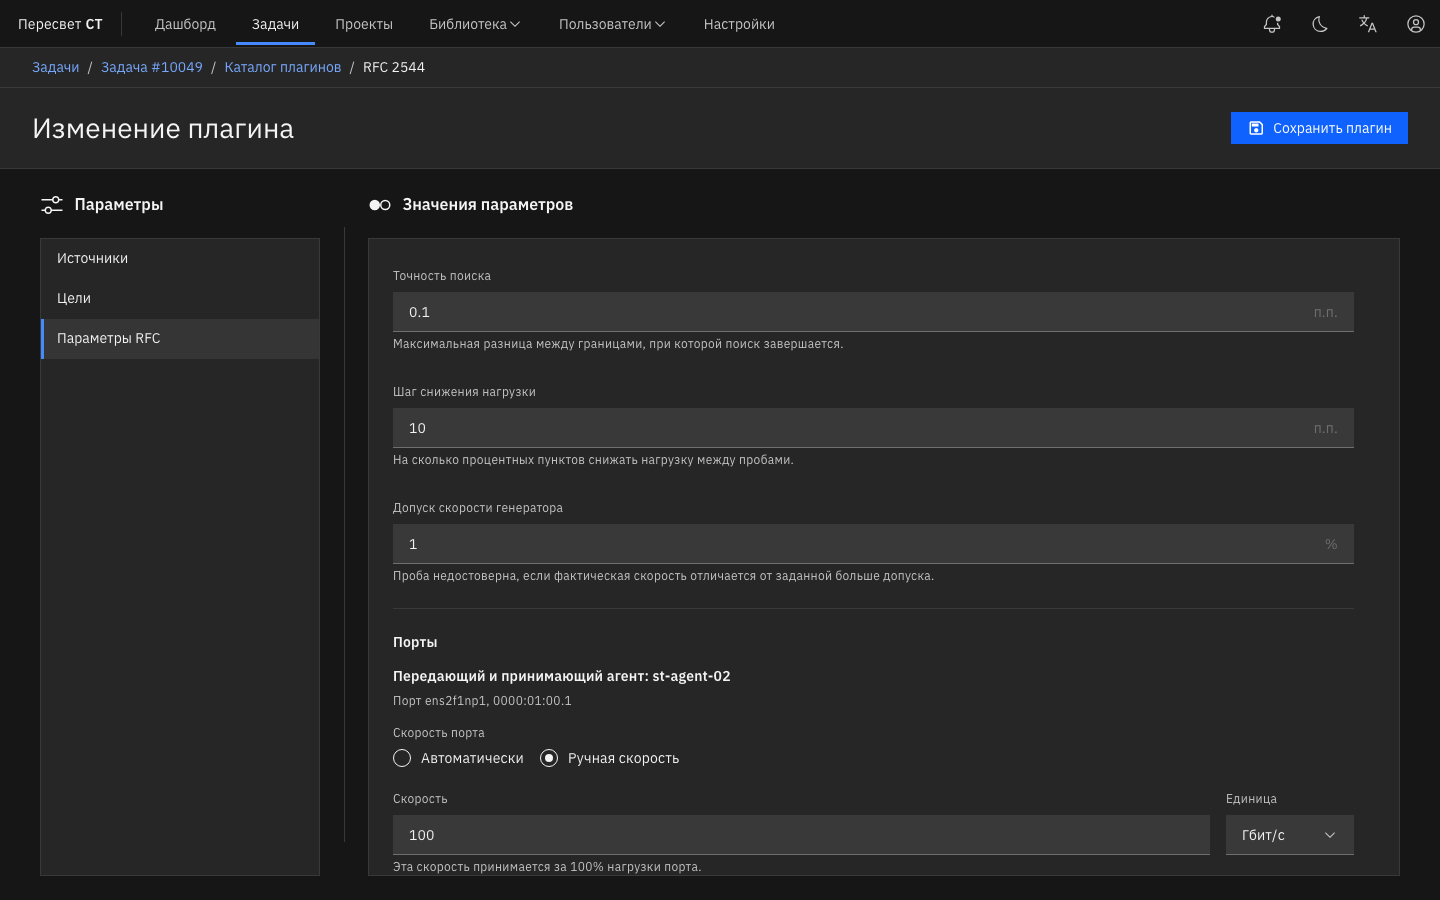
Figure 21e — The end of the trial settings and the "Ports" section
The Ports section lists the interfaces selected in the entry's sources and the agent's role in the series: transmitting, receiving, or transmitting and receiving. For each port, set the Port speed:
- Automatic: the link speed reported by the agent;
- Manual speed: a value from 1 Mbit/s to 800 Gbit/s.
This speed is taken as 100% of the port load. All percentages in the results are relative to it.
Running a Series
Start the task with Start task. Trials run one after another: for each frame size, the methodologies in the order described above, then the next size. Each trial consists of learning, a measurement of the configured duration, and the wait for last frames. Trials of the same frame size follow each other without restarting the generator; changing the frame size takes a few seconds.
The agent validates every trial before saving it. A trial is invalid if, for example:
- there is no snapshot of the transmit or receive counters;
- the actual transmit rate differs from the requested rate by more than the Generator rate tolerance;
- the measurement window on a port differs from the trial duration by more than 1%;
- more frames were received than transmitted, or foreign test frames were found.
An invalid trial stops the series with the "Measurement invalid" status; the results of completed trials are kept. The exception is a trial in which the tester itself fell short (a transmit shortfall or drops in the agent's own network card). Such a trial is repeated up to two times; if the tester still cannot carry the load, the load bounds the search from above and is marked "Limited by the tester": these trials do not describe the DUT, and the DUT throughput is no lower than the value found.
During the Reset methodology, a Reset DUT notice appears on the Metrics tab. While it says "Wait for stable reception and the 'Stream ready' message", do not reboot the DUT. After "Stream ready" appears, perform one reboot of the selected type and wait until the observation window ends: the gap is measured automatically.
Results
Results are shown on the task's Metrics tab: in the dashboard list, select RFC 2544 under General data. All panels refer to the latest run of the series and do not depend on the Grafana time range.
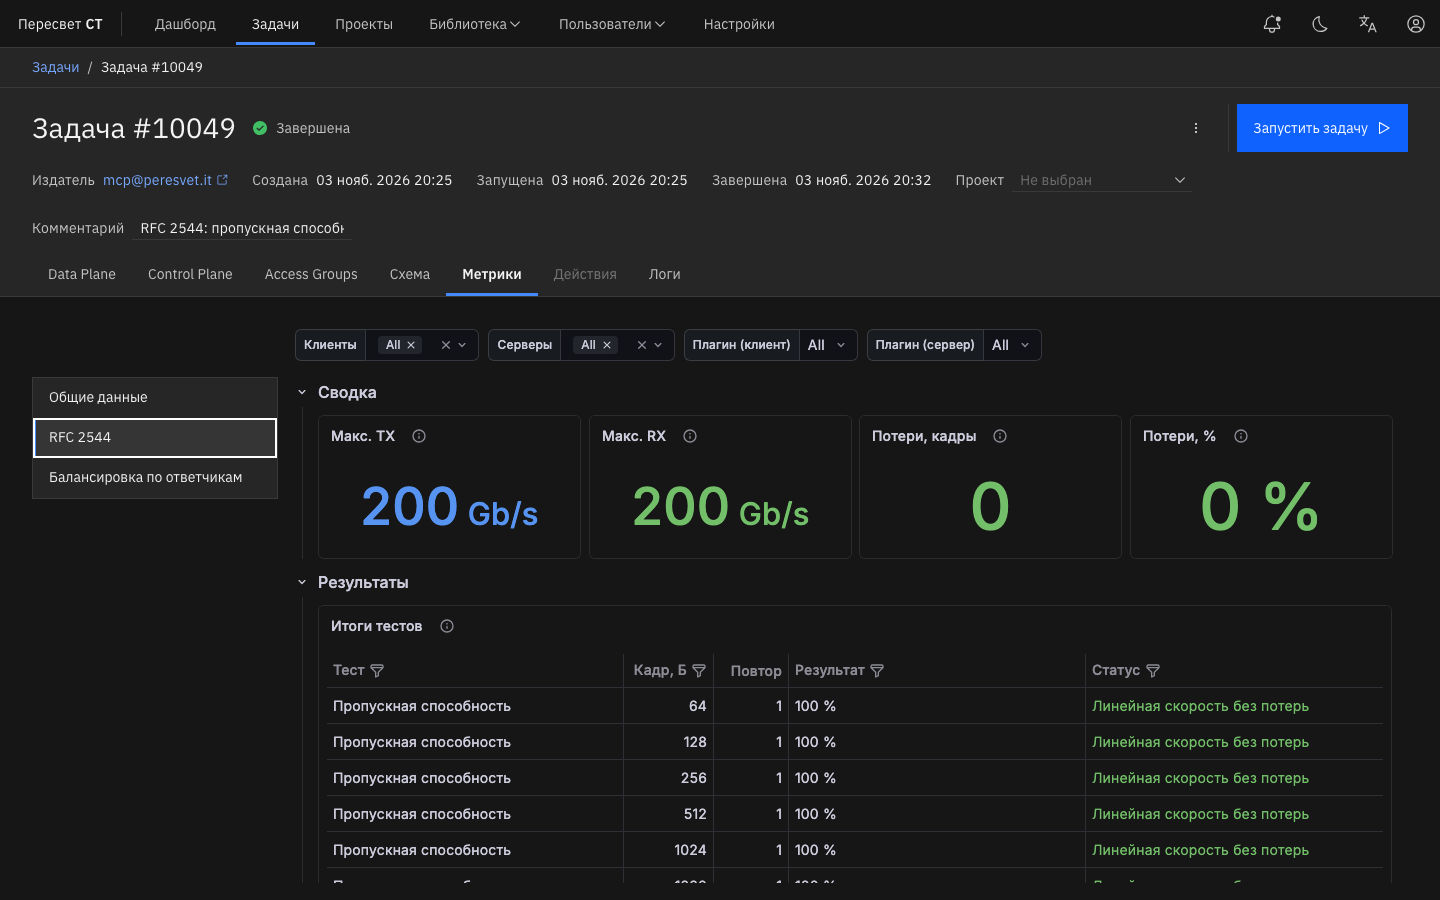
Figure 21f — The RFC 2544 dashboard on the "Metrics" tab
The Clients, Servers, Plugin (client), and Plugin (server) filters above the dashboard limit the directions shown. When only some participants are selected, the series-wide thresholds are not recalculated: the tables show measurements of the selected directions only.
Summary and test results
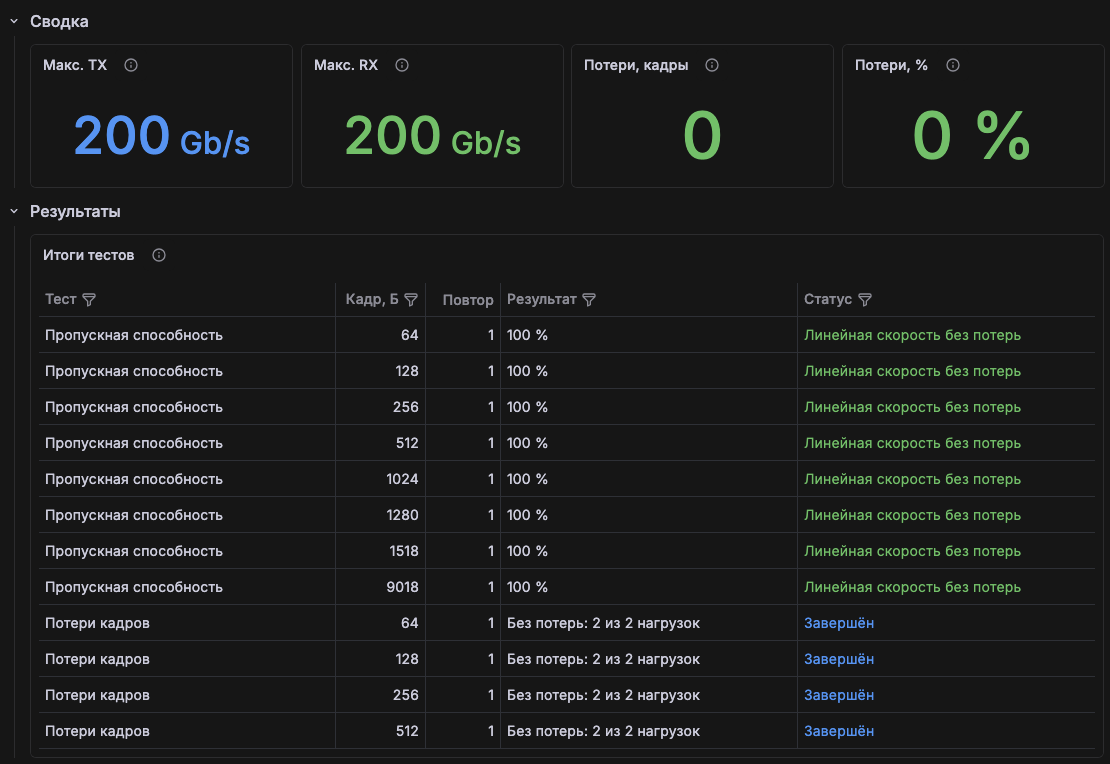
Figure 21g — The summary and the "Test results" table: the DUT forwards 100% of line rate for every frame size
The Summary panels are calculated from the valid load trials of the selected participants:
- Max TX and Max RX: the highest total transmit and receive rate in one trial. With traffic in both directions over two 100 Gbit/s ports, this is 200 Gbit/s;
- Loss, frames and Loss, %: the loss in these trials. In the throughput search and in the frame loss methodology, trials with loss are expected, so a non-zero value here does not mean an error by itself.
The Test results table is the main result of the series: one row per methodology, frame size, and repetition.
| Methodology | How to read the "Result" column |
|---|---|
| Throughput | Zero-loss load in % of the port speed, for example "100 %". The "≥" sign means the Maximum port load below 100% was passed without loss: the DUT limit was not found and can be searched for with a higher load |
| Frame loss | "No loss: N of M loads": how many load steps passed without loss. The loss at each step is in the trials table |
| Back-to-back | Loss-free burst length, "N frames" |
| Latency | "Mean: X µs", or the range of per-direction means "X–Y µs" |
| Recovery | Mean recovery time in µs |
| DUT reset | Reception gap during the reboot in µs |
If a methodology produced no result, the column shows "No valid result" or the reason, for example "No zero-loss point found".
The Status column:
| Status | Meaning |
|---|---|
| Line rate without loss | Throughput is 100%: the DUT forwards every frame at line rate |
| Load limit reached | The maximum load below 100% was passed without loss |
| Completed | The methodology finished |
| No zero-loss point found | There is loss even at the lowest load of the search |
| Range exhausted | The frame loss load dropped to zero without two consecutive loss-free trials |
| No loss-free burst found; Upper bound of the loss-free burst reached — increase the range | Back-to-back: loss even with short bursts; or a burst of the maximum length passed without loss, and the Maximum burst time should be increased |
| Recovery not confirmed within the observation time; No loss observed during overload | Recovery: loss-free reception did not return within the observation time; or the overload caused no loss, so the recovery time is undefined |
| No gap of the configured duration detected; Reset not confirmed (and other Reset statuses) | Reset: the reboot was not performed or the gap was shorter than the Minimum gap; reception did not recover within the observation window; several gaps were detected |
| Measurement invalid | A trial failed validation and the series was stopped. The reasons are in the measurement details |
| Stopped; Interrupted | The task was stopped by the user or interrupted |
Traffic
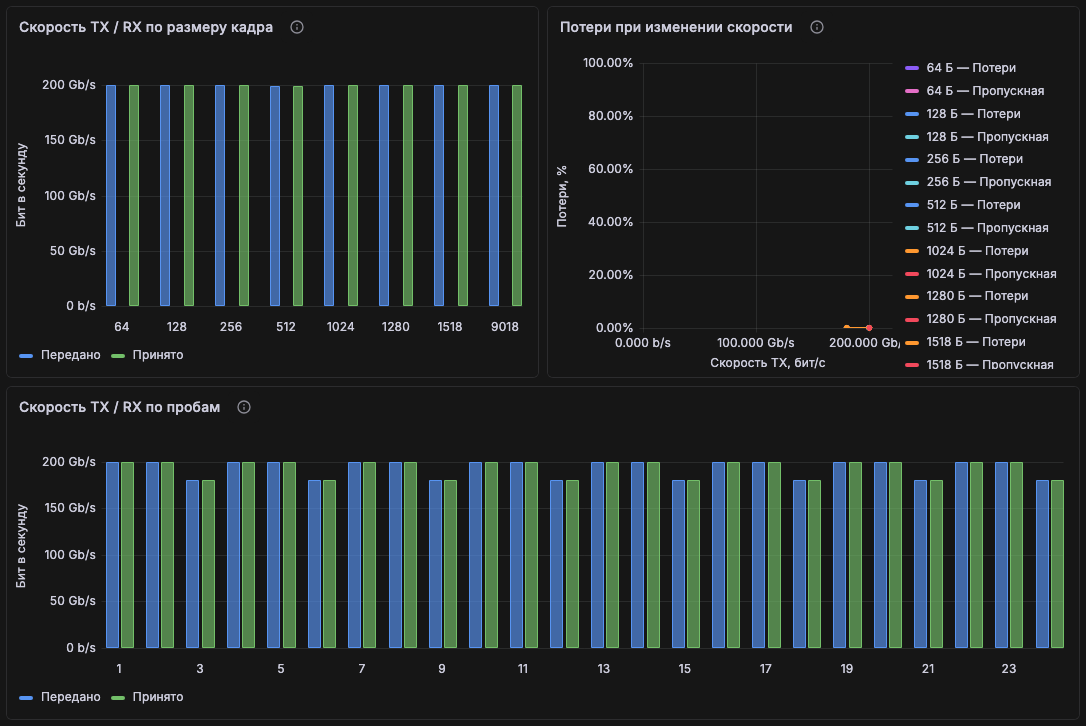
Figure 21h — TX and RX rate per frame size, loss versus rate, and rate per trial
- TX / RX rate per frame size: the trial with the highest receive rate for each frame size. The blue bar is transmitted, the green bar is received. Bars of equal height mean there is no loss.
- Loss versus rate: one point per load trial, with the actual transmit rate on the horizontal axis and the loss in % on the vertical axis. Series are labeled by frame size and methodology, for example "64 B — Loss". If all points are at zero, there is no loss; a rising curve shows the rate at which the DUT starts dropping frames.
- TX / RX rate per trial: the requested and received rate of each trial in execution order. The chart shows the load steps (for example, 100% and 90% in the frame loss methodology), repetitions, and trials with loss: in them, the green bar is lower than the blue one.
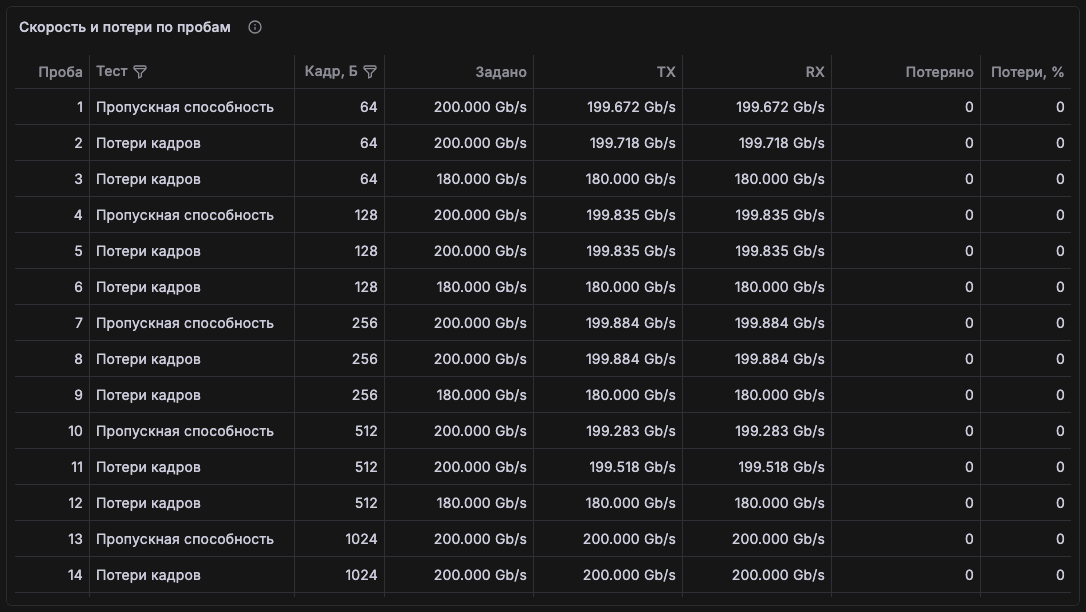
Figure 21i — The "Rate and loss per trial" table
The Rate and loss per trial table has one row per trial: number, methodology, frame size, the requested rate (Requested), the actual TX and RX, lost frames, and loss in %. Rates are in bit/s and include the Ethernet preamble and inter-frame gap (L1), so at 100% load they match the port speed. Requested is the sum over all transmitting ports of the trial. The trial number matches the number in the measurement log.
Throughput and frame bursts
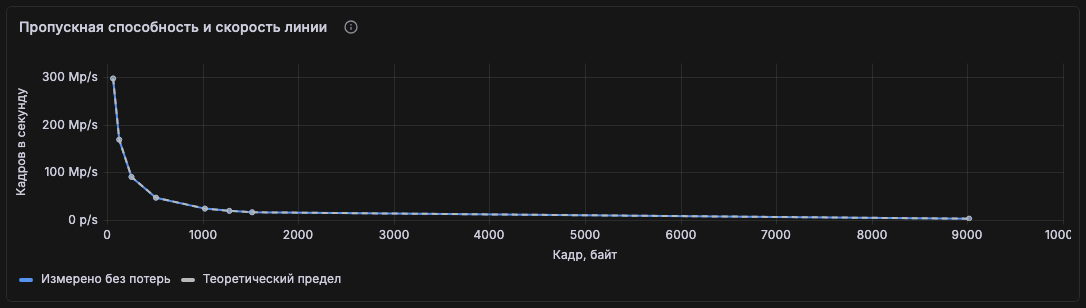
Figure 21j — Zero-loss throughput and the theoretical limit per frame size
- Throughput and line rate: zero-loss throughput in frames per second (the minimum across completed repetitions) and the theoretical rate of the selected ingress ports including the preamble and inter-frame gap. Matching lines mean the DUT runs at line rate. If the maximum load is below 100%, the measured value is a lower bound, not the found DUT limit.
- Loss-free burst length: back-to-back results: frame size, repetition, loss-free burst length in frames, the upper search bound, the mean and standard deviation across independent repetitions, and the number of measurements.
Run parameters
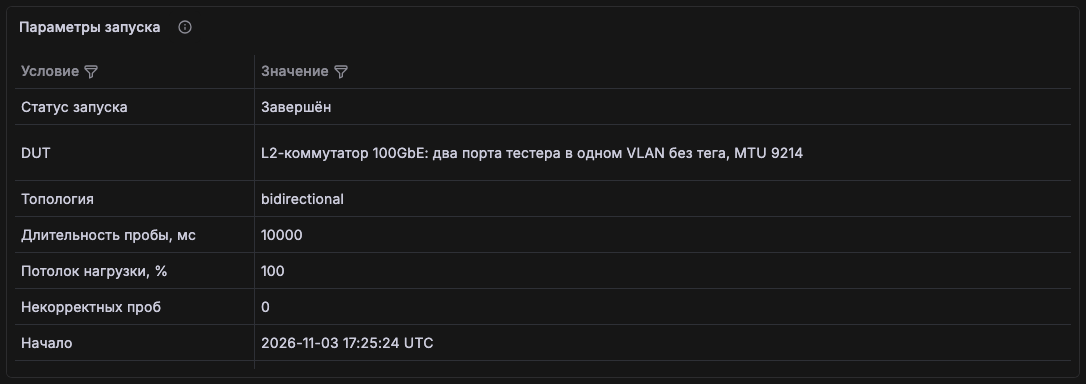
Figure 21k — Series run parameters
The Run parameters table shows the run status, the DUT description (if set), the topology, the trial duration, the load ceiling, the number of invalid trials, and the start and last update time. A "Completed" status and 0 invalid trials mean that every trial in the series is valid.
Measurement details
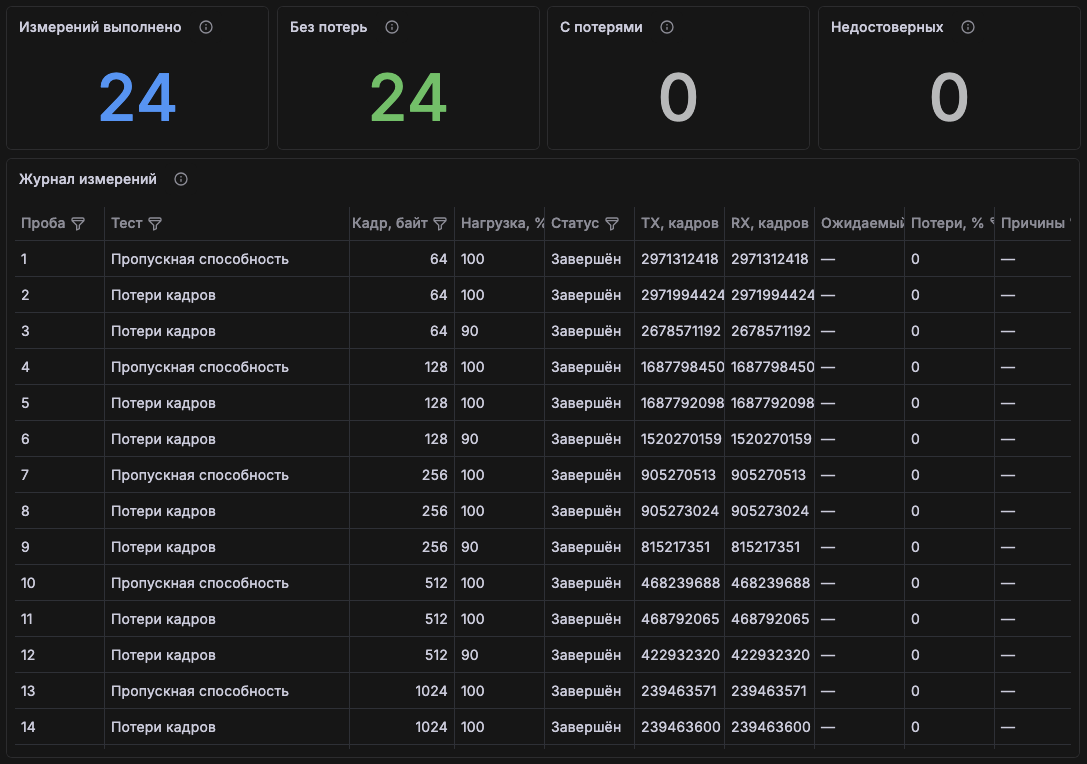
Figure 21l — Trial counters and the measurement log
- Measurements performed: all trials, including invalid ones. One trial is a measurement of one methodology at the selected frame size and load.
- No loss and With loss: valid trials without loss and with loss. "No loss" does not mean that all RFC methodologies were run.
- Invalid: trials that failed the counter, timing, or measurement condition checks.
- Measurement log: every trial with its number, methodology, frame size, load in %, status, transmitted and received frames, expected reception, loss, and invalidity reasons. Counters are shown in full, without rounding.
- Conditions and invalidity reasons: the DUT configuration (if set), methodology limitations (for example, trials shorter than the recommended 60 s), and the reasons trials were marked invalid.
Latency, recovery, and reset
These sections are filled in if the corresponding methodologies are selected:
- Latency per direction: the mean latency in each direction; only samples that were actually saved are shown.
- Latency with a hardware receive timestamp: latency from the software transmit timestamp to the network card's hardware receive timestamp (SW TX → HW RX). It includes the time in the tester's transmit queue and is shown if the agent's network card supports hardware receive timestamps.
- Recovery after load reduction: the mean, minimum, and maximum Recovery time per direction and the number of samples. 0 µs means no additional gap was detected at the method's resolution.
- Recovery after reset: the measured reception gap, if a Reset was actually performed.
Report and export
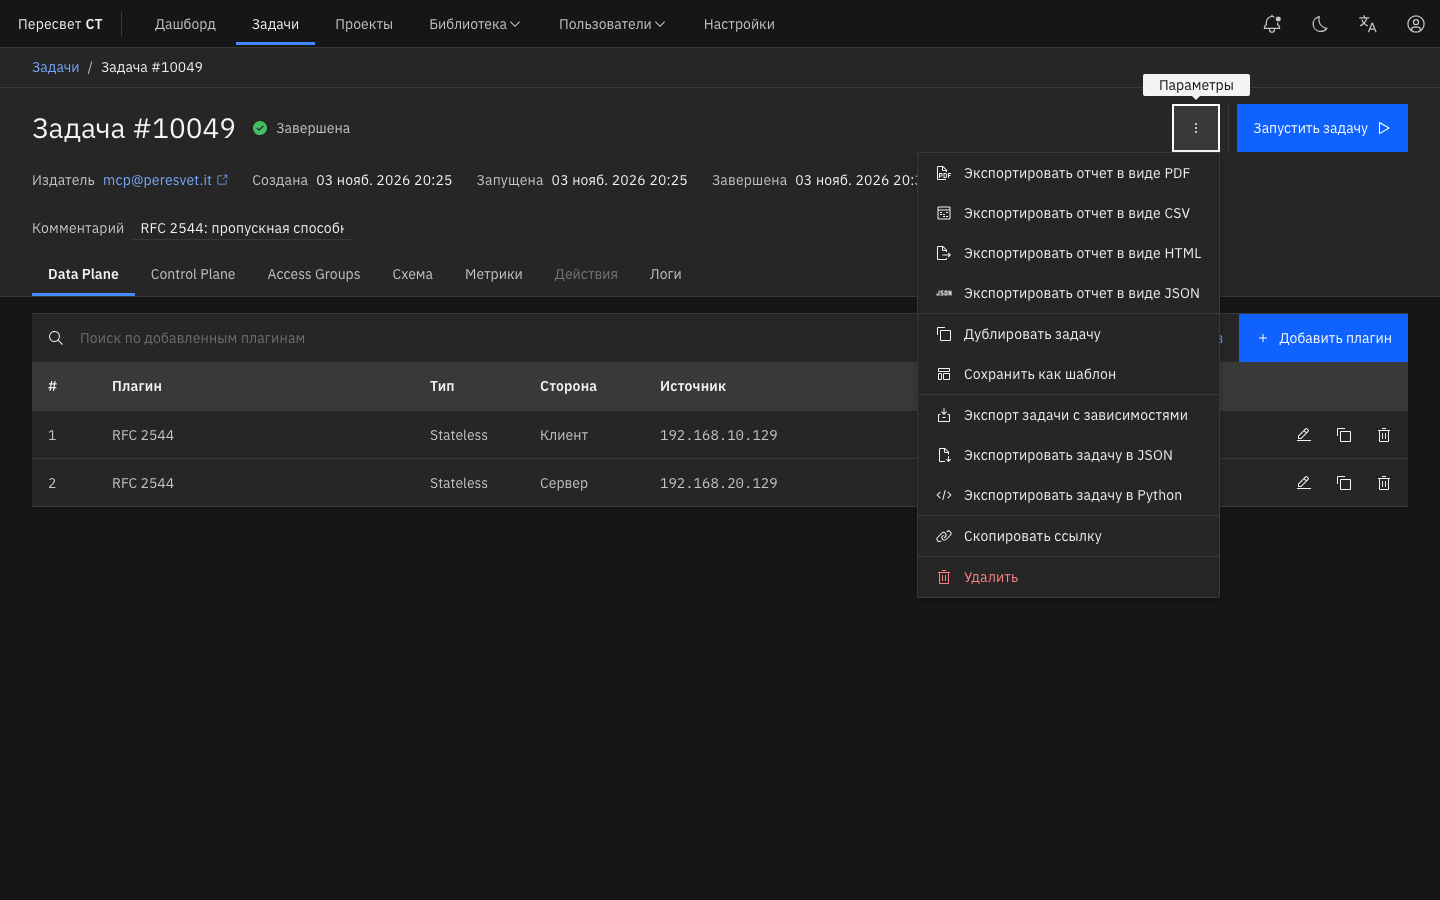
Figure 21m — Report export from the "Parameters" menu (⋮)
The report is exported from the Parameters menu (⋮) on the task page (see Report Export and Task Import):
- PDF and HTML contain the "RFC results" section: the frame check mode, the results per methodology and frame size with notes (skipped methodologies, tester limits), and every trial with per-stream data;
- CSV: one row per stream of every trial: methodology, frame size, repetition, load, status, loss, source and target, transmitted, received, and lost frames, duplicates, reordered frames, rates, and errors;
- JSON (the Export Report as JSON item, available only for RFC and Y.1564 tasks): the raw measurements of the latest run: the run description and all trials.
Evaluating the Result
- Check Run parameters: the status is "Completed" and there are 0 invalid trials.
- In Test results, find the throughput for each frame size. 100% and the "Line rate without loss" status mean that the DUT forwards all traffic at line rate. A value below 100% is the DUT limit found for that frame size; "≥" means the limit was not found, so increase the Maximum port load.
- Compare the TX and RX bars and the loss chart to see at which frame sizes and rates loss appears.
- If the report shows "Limited by the tester", the trials at that load do not describe the DUT, and the DUT throughput is no lower than the value found. To check a higher load, try accelerated testing.