Metrics and Dashboards
Peresvet ST collects metrics in real time and exports them to ClickHouse. Grafana visualizes the results, with one or more preconfigured dashboards for each plugin type. Dashboards are available from the Peresvet ST web interface while a task is running.
PDF/CSV/HTML report export and task transfer (archive/JSON) are described under Report Export and Task Import.
Reading One-Second Metrics
Peresvet ST metrics show actual traffic behavior over short intervals. On most graphs, a point represents one second of measurements: the number of requests, responses, packets, bytes, or bits that were actually generated, transmitted, received, or processed within that one-second window.
The system does not artificially smooth these graphs over five or ten seconds or draw an idealized target-profile line. Small natural variations may therefore be visible: one second slightly below the target and the next slightly above. This is normal for exact one-second measurements, especially with TCP, HTTP, and many concurrent sessions.
Real network traffic also does not arrive in perfectly identical one-second batches. TCP connections open and close over time; an HTTP request depends on connection readiness and the response; packets are grouped by the NIC and processed by multiple agent cores; and one-second boundaries do not align with individual session boundaries. When events straddle two seconds, adjacent points can differ slightly even though the working-interval average and total traffic volume match the configured profile.
In practice:
- evaluate the plateau after ramp-up and before task shutdown when checking the rate;
- account for CPS and CC: if a task opens 100 new connections per second until it reaches 1,000 active connections, the plateau appears only after ramp-up;
- evaluate the average and total volume over the selected interval, not a single one-second point;
- compare software and hardware metrics: software metrics show what the scenario generated and processed; hardware metrics show what physically crossed the network interface;
- check Drops and loss separately: with zero loss, small one-second fluctuations normally reflect measurement precision rather than a generation problem.
In an HTTP task targeting 10,000 requests per second, the line remains close to the target after ramp-up. Individual points may show 9.9K or slightly more than 10K RPS, but the working average on the plateau matches the target profile.
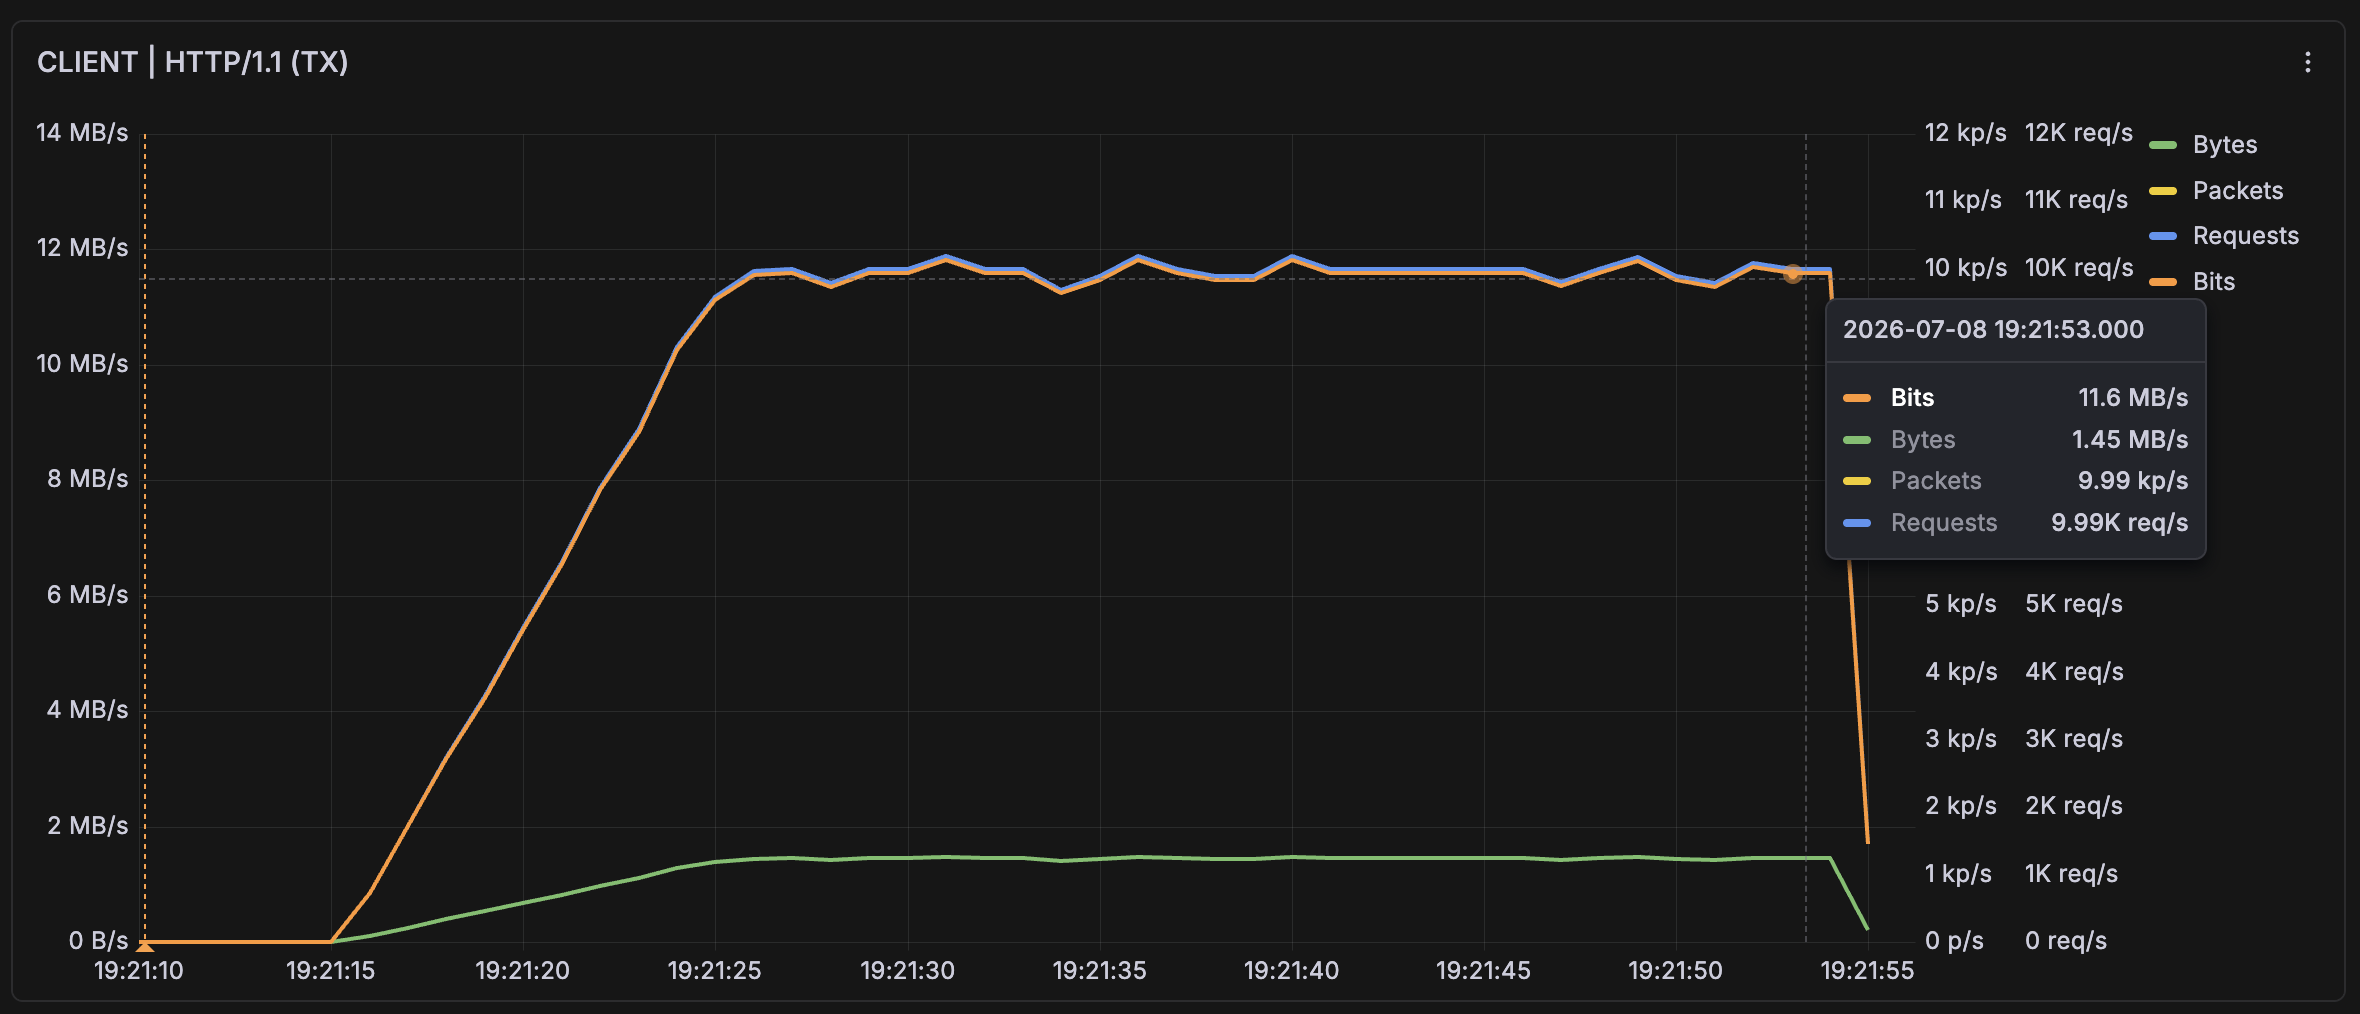
Figure 24 — HTTP load at 10K RPS: exact one-second values around the target profile
Similar behavior can appear on total packet or bit graphs. If the profile specifies a constant rate but the graph uses actual one-second intervals, a small staircase effect or compensation in the adjacent second is acceptable. Acceptance should focus on the working plateau, average, total traffic volume, and absence of loss.
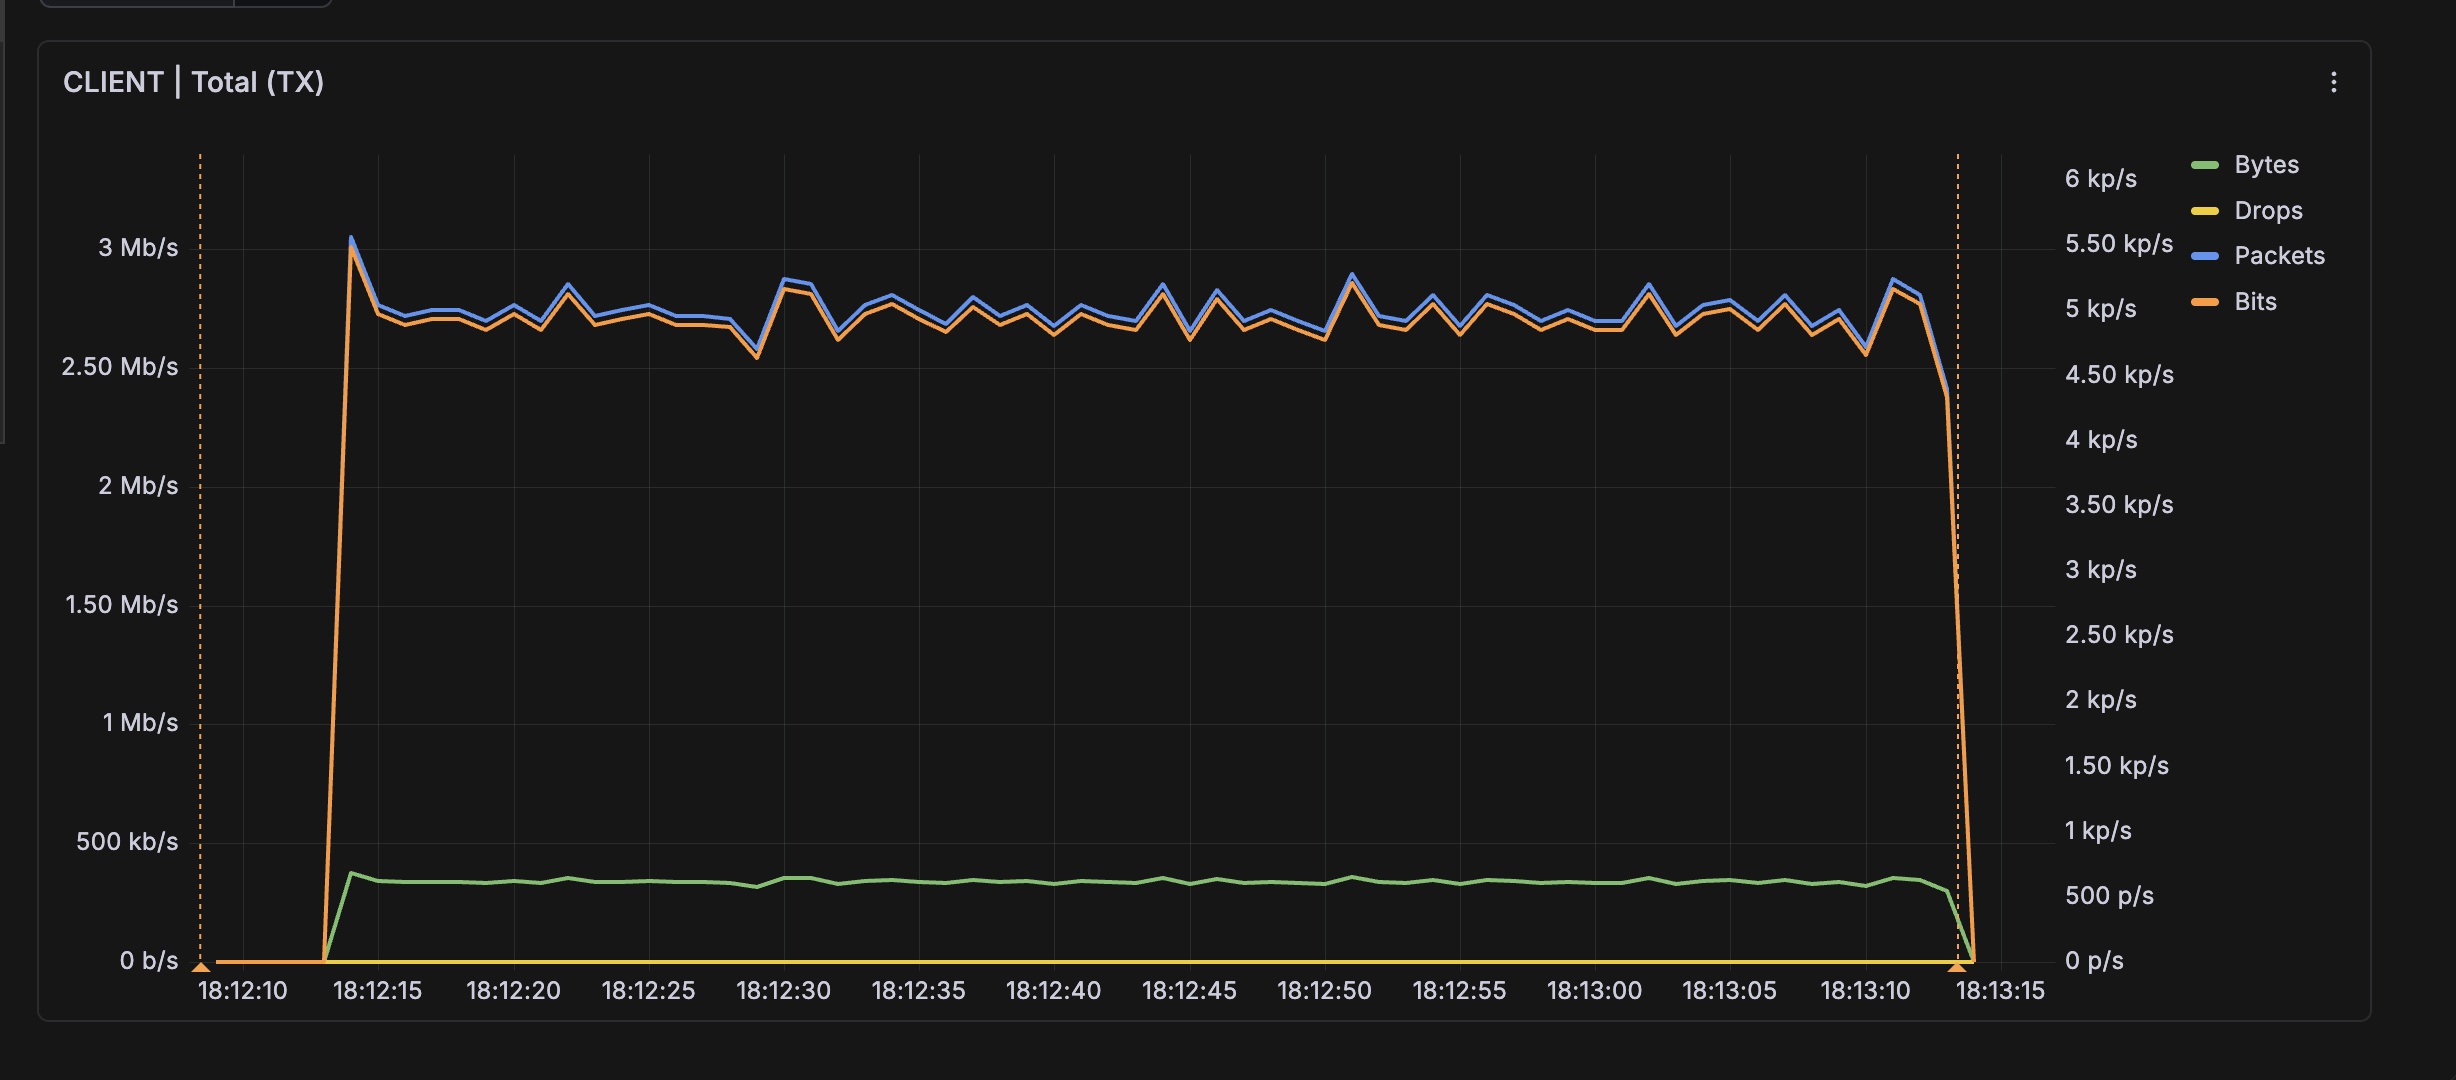
Figure 25 — Total TX graph: actual one-second intervals without artificial smoothing
Main Metric Groups
Dashboards use several types of indicators. They describe different layers of the same test and should be read together.
| Group | What it shows | How to interpret it |
|---|---|---|
| Requests / Responses | Application operations: HTTP and DNS requests/responses, file-transfer operations, and other L7 events | Verify the application's business profile: how many operations actually completed per second or over the interval |
| Packets | TX/RX network packet count | One application request can produce one or many packets. With TLS, large responses, fragmentation, or retransmission, packet count does not have to match request count |
| Bytes / Bits | Transferred data volume and rate | Evaluate payload and L2/L3 rate. With a fixed packet size, Bits and Packets usually move together |
| L1 / L2 Bits | Rate at different accounting layers | L2 represents Ethernet frame volume; L1 also includes physical line overhead and is therefore used for line-rate evaluation |
| TCP Connections | Connection attempts, active, closed, and pending connections | Total connection attempts is the running total of initial TCP connection attempts; Total active connections and Total pending connections show current state; Connections/s and Closed connections/s show per-second establishment and closure rates |
| Drops / Loss | Loss, discarded packets, and RX/TX errors | Evaluate drops/loss after completion. During a run, short-lived loss in Total Statistics can be an artifact of metrics arriving from agents at different times; see below |
| Generated / Software | Scenario counters within the agent | Show how much traffic the scenario generated, processed, and accounted for at the application or network-stack layer |
| Hardware / Physical | Network-interface hardware statistics | Show actual physical-port traffic: line rate, L1/L2 bits, hardware packet counts, and interface errors |
Software and hardware metrics complement rather than replace each other. Software metrics validate scenario logic: requests, responses, sessions, applications, response codes, latency, and errors. Hardware metrics confirm that traffic actually left the port and was received by the NIC. First confirm that the scenario reached its plateau, then compare software and hardware, and finally evaluate drops/loss.
Personalized Dashboards
Personalized dashboards add specialized views for particular test scenarios to the standard task metrics. Each dashboard supports a separate analysis objective and can be enabled independently.
They are disabled by default because the agent collects extra traffic detail for them. Before starting a task, an administrator must open Settings → Dashboards, click Select Dashboards, choose the required dashboards, and apply the change. Additional metrics are collected from the next task run; they are not calculated retroactively for a running or completed task.
Once enabled, the selected dashboards appear on the Metrics tab of applicable tasks.
Responder Load Balancing
Responder Load Balancing is intended for testing load balancers, DSR/IP-IP designs, and other solutions that distribute inbound traffic among multiple server IP addresses. It adds a per-responder view to the total task metrics and verifies not only aggregate rate but also the actual uniformity of distribution.
The dashboard groups metrics by responder IP and shows traffic entering the responder side—what the client sent to the servers. The reverse flow, which servers transmit and the client receives, appears on general dashboards as Server TX / Client RX and is not included in this per-responder RX view. With small requests and large responses, Client RX can therefore be much greater than responder RX. These are different directions of one exchange, not an error.
The dashboard contains:
| Block | What it shows |
|---|---|
| Active / total responders | IP addresses that received inbound traffic and the total observed group size (Responder Size) |
| No inbound traffic | Responders that received no traffic during the selected interval |
| Maximum TCP CPS deviation | Largest deviation of one responder's TCP establishment rate from the group average |
| Top 10 underloaded / overloaded | IP addresses with the greatest negative and positive deviations from the average distribution |
| Selected responder details | TCP CPS, TCP CC, pending/closed connections, and inbound bits/packets for selected IP addresses |
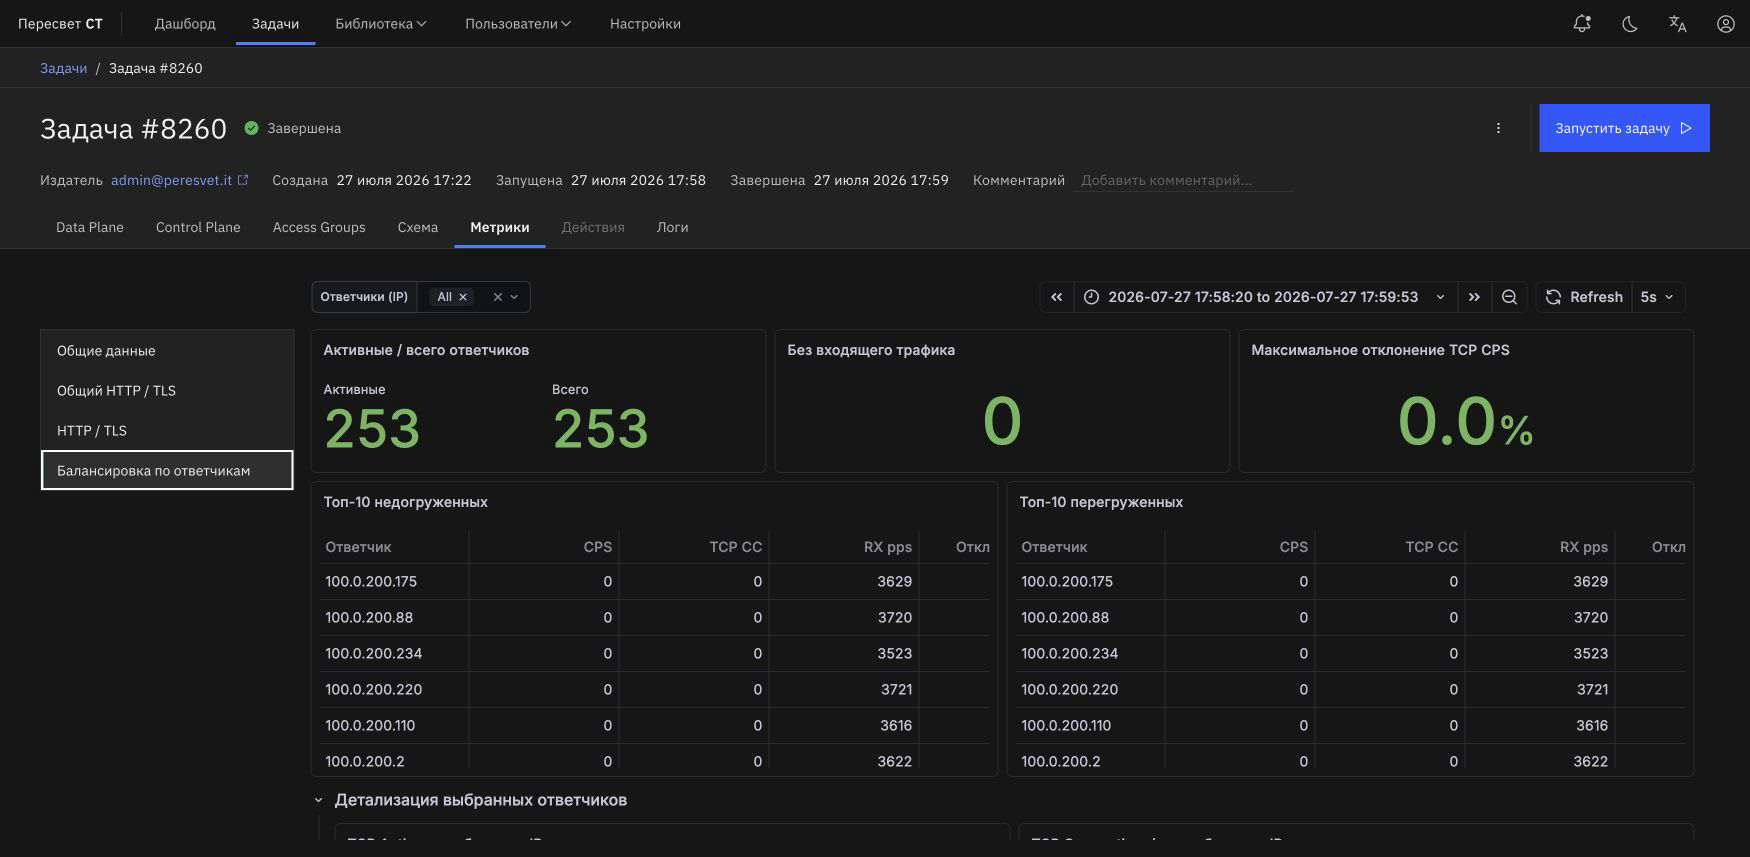
Figure 25a — Load-distribution summary by responder IP address
The dashboard analyzes a group of up to 256 responder IP addresses in one test profile. With more addresses, total task metrics continue to show aggregate traffic, but Responder Size and per-IP distribution details may be incomplete.
Total Metrics
The Total dashboard and Total Statistics section show aggregate task indicators: sent, received, and lost packets/bits in each direction between agents.
| Metric | Description |
|---|---|
| total.rx.packets / total.tx.packets | Total received/transmitted packets |
| total.rx.bytes / total.tx.bytes | Total received/transmitted bytes |
| total.tx.drop | Packets discarded during transmission |
| total.pkt.lost | Lost packets |
| total.rx.bad | Invalid received packets |
| total.tx.l1_bits / total.rx.l1_bits | TX/RX L1 bit rate, including inter-frame gaps and preambles |
| total.tx.line_rate / total.rx.line_rate | TX/RX line utilization (%) |
| total.cpu_usage | Share of a DPDK lcore's one-second budget spent in productive RX, scheduler/launch, and timer phases; empty polls and no-op passes are excluded |
| total.tos.rx | Received packets analyzed by ToS |
| total.rx.imissed | Packets missed by the NIC because a queue overflowed |
| total.rx.ierrors | NIC-level receive errors |
Total Statistics: Loss During Execution
The Total Statistics (Packets) and Total Statistics (Bits) tables calculate loss as the difference between transmission on one side and reception on the other, grouped by the agent-to-agent direction and interfaces.
Agents write metrics to ClickHouse independently and do not synchronize batch-send times. While a task is running, a dashboard can briefly lag: TX on one agent has updated while RX on the other has not, or vice versa. Lost or Loss (%) can then become nonzero for seconds or minutes before decreasing or returning to zero when the lagging side catches up. Visibility depends on the traffic rate and when the Metrics tab is opened.
This is most visible when the task uses two separate agents. When both directions use one agent with two interfaces, the skew is generally smaller, but a brief imbalance is still possible.
For acceptance, inspect Total Statistics after the task has completed fully and stably and both agents have written final metrics. Final loss on a stopped task is the primary reference; transient nonzero loss during a run alone does not prove that the DUT dropped packets.
Agent Health
The Agent Health section on Total (Dual) complements traffic metrics with the state of the machines running Peresvet. An agent samples telemetry every second while a task is being prepared, run, and stopped. Every sample carries the task ID, so the dashboard shows the machine state during the analyzed run rather than its current state after the run.
The Agent Status table reports one of four outcomes:
| Status | Meaning |
|---|---|
| Healthy | Telemetry coverage is sufficient, local drop/error counters did not grow, and no fault or sustained resource shortage was detected |
| Near Capacity | No confirmed fault occurred, but CPU utilization or the minimum ordinary-memory headroom approached a diagnostic threshold |
| Agent Problem | The run recorded a local drop/error, link loss, OOM, PCIe error, or unexpected data-plane exit |
| Insufficient Data | Telemetry is missing, has substantial gaps, or the agent could not reliably export every sample |
Healthy means that no indication of a Peresvet-side problem was detected during the selected interval. It narrows the investigation scope but does not by itself prove that the device under test is faulty.
| Indicator | How to interpret it |
|---|---|
| Coverage | Percentage of expected one-second samples. Status cannot be Healthy below 90% coverage |
| Data-plane load p95 / max | Share of the busiest DPDK lcore's one-second budget spent in productive RX, scheduler/launch, and timer phases. Empty polls and no-op passes are excluded |
| Host CPU p95 | Whole-machine Linux CPU utilization, including continuously running DPDK poll loops. It shows the share of cores reserved for data plane but changes little with traffic intensity |
| Minimum available RAM | Lowest MemAvailable percentage; Linux file cache is not treated as unconditionally occupied memory |
| Minimum free hugepages | Lowest hugepage headroom. Hugepage use during a task is expected and is not an error by itself |
| System Trace maximum RSS | Maximum resident memory of the traffic-generation process |
| Drop/error | Combined increase in local software, NIC, and PCIe counters that can affect test results |
| Critical events | OOM-killer activity, unexpected data-plane termination, link loss, and severe PCIe errors |
| Maximum temperature | Highest available reading from the agent's hardware sensors |
| Clock synchronized | Kernel-reported system clock synchronization; N/A means the operating system did not expose the state |
The Data-plane Load and Host CPU chart deliberately plots two different indicators. Host CPU is Linux occupancy: poll-mode DPDK cores continuously poll the NIC and consume CPU even with no packets. For example, 64 reserved cores on a 128-logical-CPU host produce about 50% Host CPU regardless of traffic rate. Data-plane load accumulates productive time during each real one-second window on every DPDK lcore: non-empty RX batch processing, scheduler/launch work, and timer work. Empty NIC polls and no-op loop passes are excluded, so a change in batch size alone should not appear as CPU load moving between agents. The chart and summary p95/max values stop at the traffic_stop event so a compute-intensive graceful drain is not misclassified as production-traffic saturation. A meaningful capacity problem is high Data-plane load accompanied by drop/error growth or failure to reach the configured traffic rate.
The Agent Memory chart similarly separates ordinary RAM from hugepages. Ordinary-memory headroom uses MemAvailable, not Total - Free. A low free-hugepage percentage during a run is expected because DPDK reserves those pages in advance. OOM, an allocation failure, or insufficient preparation-stage headroom is diagnostically significant.
The Agent Health Events table contains timestamped discrete events: data-plane start and stop, link loss, PCIe AER growth, and OOM. If a hardware source is unavailable, the UI reports missing data instead of presenting a fabricated zero.
Agent Anomalies
The Agent Anomalies table on Total (Dual) shows packets and events discarded by the NIC or software stack on a particular agent. These are local diagnostic counters. They are not the same as client-to-server loss in Total Statistics and do not by themselves prove that the DUT dropped packets.
Values are counter increases during the selected dashboard interval, grouped by agent and interface. Zero means that the counter did not increase during that interval.
| Column | Meaning |
|---|---|
| Agent | Agent on which the anomaly was recorded |
| Interface | Agent network interface associated with the counter |
| TX drop | Packets prepared by the software stack but not placed in the transmit queue. Growth usually means that the agent or NIC cannot transmit generated traffic fast enough |
| RX missed | Packets missed by the NIC before delivery to the software stack, for example because an RX queue overflowed. Often indicates that the agent cannot drain RX fast enough at the current load |
| RX discards | Internal NIC-side discards. On Mellanox, this is rx_phy_discard_packets, which can grow because of limits in the card's internal pipeline or PCIe exchange |
| RX errors | Receive errors reported by the NIC or driver |
| RX bad | Packets that reached the software stack but were considered invalid, for example because of a bad checksum, invalid format, or parsing/decapsulation error |
| RX no_ws | No matching task worker context was found for the received packet. Check protocol, addresses, interface, configuration, and routing to the correct processing queue |
| RX nombuf | The NIC could not obtain a free buffer for another received packet. Growth indicates too few packet buffers or delayed release under high load |
| TCP drop | Total packets discarded by the agent software TCP stack, including the adjacent reasons and other TCP drop causes |
| Bad seq server | The client agent received a server packet whose TCP sequence/ACK values did not match the located client socket state |
| No socket client | The client agent received a packet for the configured address range but found no active client TCP socket for the connection. Causes include a late packet after closure, an unexpected IP/port combination, delivery to the wrong processing context, or state desynchronization under load |
| SYN/ACK bad ACK | The client received a SYN/ACK whose acknowledgment number did not correspond to its SYN; the response cannot complete the handshake and is dropped |
| Bad seq client | The server agent received a client packet whose TCP sequence/ACK values did not match the located server socket state |
| Total | Sum of TX drop, hardware/general RX anomalies, and TCP drop. Individual TCP drop reason columns are not added again, so a single TCP drop is not counted twice |
HTTP / TLS
Total HTTP/TLS aggregates all HTTP plugins. HTTP/TLS provides per-plugin details.
| Metric | Description |
|---|---|
| http_1_1.tx.requests / http_1_1.rx.responses | Sent requests / received responses (HTTP/1.1) |
| http_1_1.tx.bytes / http_1_1.rx.bytes | TX/RX data volume |
| http_1_1.code.1xx–5xx | HTTP response code distribution (1xx, 2xx, 3xx, 4xx, 5xx) |
| http_1_1.ttfb | Average TTFB from HTTP/1.1 request transmission until the client processes the first response byte |
| http_1_1.ttlb | Average TTLB from HTTP/1.1 request transmission until the client processes the complete response |
| http_1_1.wire_ttfb | Wire TTFB from HTTP/1.1 request transmission until the client NIC timestamps the first response byte |
| http_1_1.method.get/post/put/patch/delete | Requests by HTTP method |
| http_2.tx.requests / http_2.rx.responses | Sent requests / received responses (HTTP/2) |
| http_2.code.1xx–5xx | HTTP/2 response code distribution |
| http_2.ttfb / http_2.ttlb | Average time to the first byte / complete HTTP/2 response |
| http_2.streams.opened/closed/reseted | Opened/closed/reset HTTP/2 streams |
| tcp.tx.flags.syn − tcp.rt.syn | Total connection attempts: running total of initial SYN packets submitted by the client TCP stack to the transmit path since the task started; retransmitted SYN packets for the same attempt are excluded. A new initial SYN after timeout or closure counts as a new attempt. Physical port transmission must be confirmed with hardware TX counters or a traffic capture |
| tcp.cps | Connections/s: TCP connections successfully established per second |
| tcp.cc | Total active connections: total current established TCP connections |
| tcp.pending | Total pending connections: total current TCP connections with an incomplete handshake |
| tcp.closed | Closed connections/s: TCP sockets closed per second, both before handshake completion and after establishment |
| tcp.hs_avg_delay | Average handshake delay from SYN transmission until the client software TCP stack processes SYN/ACK |
| tcp.hs_wire_avg_delay | Wire RTT from SYN transmission until the client NIC timestamps SYN/ACK |
| TCP Data RTT Avg | Average time from transmission of a selected data-bearing TCP segment until its acknowledging ACK; calculated from exact values, excluding retransmissions |
| TCP Data RTT P50 / P95 / P99 | Data RTT percentiles rounded up to the nearest bucket boundary; for example, 15 ms means greater than 10 ms and at most 15 ms |
| TCP Wire Data RTT Avg / P50 / P95 / P99 | The same measurement with a hardware timestamp for the incoming ACK at the client NIC |
| TCP Data RTT Jitter | Average change in Data RTT between adjacent measurements |
| TCP Data RTT Samples | Completed measurements and measurements excluded because of retransmission |
| tls_1_2.hs_avg_delay / tls_1_3.hs_avg_delay | Average TLS session establishment delay after the TCP handshake completes |
| tls_1_2.* / tls_1_3.* | Other TLS 1.2/1.3 metrics: packets, bytes, CPS, CC, and Client/Server Hello |
Latency metrics cover the full path observed by the client agent: traversal through the DUT, server-agent processing, and return traffic. TCP Data RTT runs from queuing a selected segment for transmission until its acknowledging ACK is received. Wire Data RTT hardware-timestamps ACK reception at the client NIC but still includes transmit-queue wait on the server agent.
At close to 100% line utilization, an ACK can wait behind data packets, increasing P95/P99 even without loss or retransmission. When comparing DUT impact, make sure the agents are not bottlenecks and leave 5–10% L1 headroom.
Wire RTT, Wire Data RTT, and Wire TTFB require compatible hardware and are available only on Peresvet ST appliances. They are unavailable on virtual machines and other deployment types.
Latency Measurement (IP/UDP)
The Latency Measurement (IP/UDP) dashboard shows results from the plugin of the same name. Latency is calculated on the client agent from server-side responses.
| Panel / metric | Description |
|---|---|
| CLIENT | UDP RTT — Avg RTT | Average time from measured UDP request transmission until the client agent receives the response |
| CLIENT | UDP RTT — P50 / P95 / P99 RTT | RTT percentiles rounded up to the nearest bucket boundary |
| CLIENT | UDP Wire RTT — Wire RTT | Average control-flow RTT with hardware response timestamping at the client NIC |
| CLIENT | UDP Wire RTT — P50 / P95 / P99 Wire RTT | Control-flow Wire RTT percentiles with hardware response timestamping |
| CLIENT | UDP RTT Jitter — Avg RTT jitter | Average absolute RTT change between adjacent measured responses |
| CLIENT | UDP RTT Jitter — Wire RTT jitter | The same change for Wire RTT |
| CLIENT | Measured samples — RTT samples/s | Responses per second included in RTT calculation |
| CLIENT | Measured samples — Wire RTT samples/s | Control-flow responses per second with a hardware timestamp |
| CLIENT | UDP requests and responses | All sent UDP requests and received responses; lines can temporarily differ at a one-second boundary |
Packets are sent at the configured rate, while RTT and jitter use a uniform sample. The measured sample count can therefore be lower than the request count. RTT includes both directions through the DUT and response processing by the server agent.
UDP RTT runs from queuing a selected UDP request for transmission until the client agent receives its response. Wire RTT hardware-timestamps response reception at the client NIC but still includes response transmit-queue wait on the server agent.
At close to 100% line utilization, a UDP response can wait behind other packets, increasing P95/P99 even without loss. When comparing DUT impact, make sure the agents are not bottlenecks and leave 5–10% L1 headroom.
Wire RTT and Wire RTT jitter require compatible hardware and are available only on Peresvet ST appliances. They are unavailable on virtual machines and other deployment types.
TCP Flood (SYN / SYN-ACK / ACK / RST / RST-ACK / FIN / FIN-ACK / PSH / PSH-ACK / Xmas)
Total TCP aggregates all TCP flood plugins. Each flood type also has its own dashboard, such as TCP SYN, TCP ACK, or TCP Xmas.
| Metric | Description |
|---|---|
| tcp.tx.flags.syn / tcp.rx.flags.syn | Sent/received SYN packets |
| tcp.tx.flags.syn_ack / tcp.rx.flags.syn_ack | Sent/received SYN-ACK packets |
| tcp.tx.flags.ack / tcp.rx.flags.ack | Sent/received ACK packets |
| tcp.tx.flags.rst / tcp.rx.flags.rst | Sent/received RST packets |
| tcp.tx.flags.rst_ack / tcp.rx.flags.rst_ack | Sent/received RST-ACK packets |
| tcp.tx.flags.fin / tcp.rx.flags.fin | Sent/received FIN packets |
| tcp.tx.flags.fin_ack / tcp.rx.flags.fin_ack | Sent/received FIN-ACK packets |
| tcp.tx.flags.psh / tcp.rx.flags.psh | Sent/received PSH packets |
| tcp.tx.flags.psh_ack / tcp.rx.flags.psh_ack | Sent/received PSH-ACK packets |
| tcp.tx.flags.xmas / tcp.rx.flags.xmas | Sent/received Xmas packets (all flags) |
| tcp.tx.packets / tcp.rx.packets | Total TX/RX TCP packets |
| tcp.tx.bytes / tcp.rx.bytes | TX/RX TCP data volume |
UDP Flood
Total UDP is the aggregate dashboard; UDP provides details.
| Metric | Description |
|---|---|
| udp.tx.packets / udp.rx.packets | Sent/received UDP packets |
| udp.tx.bytes / udp.rx.bytes | TX/RX UDP data volume |
| udp.rt | UDP round-trip response time |
| udp.drop | Lost UDP packets |
Fuzzing (L3-L7)
The Fuzzing (L3-L7) dashboard shows the results of enabled UDP/TCP Fuzzing modules and flow scenarios. It verifies the actual transmission rate, traffic volume, and L4 session state during a test.
| Dashboard block | What it shows |
|---|---|
| L3-L4 Fuzzing overview | Task summary and Fuzzing profile activity over the selected interval |
| UDP: sent packets | Separate lines for enabled modules: invalid checksum, TTL, DSCP/ECN, IP ID, Payload Data, and UDP Flow |
| TCP: sent packets | Separate lines for enabled modules: PSH/ACK, invalid checksum, SEQ, MSS, Window Scale, TCP window, Payload Data, and TCP Flow |
| UDP: sent bytes / bits | UDP traffic volume and rate in bytes/bits |
| TCP: sent bytes / bits | TCP traffic volume and rate in bytes/bits |
| L4 sessions / flow | TCP session and UDP flow state when flow modules are enabled |
| TCP Connections | TCP session creation, activity, and closure |
| UDP Flow Sessions | UDP flow count and activity |
When several Fuzzing modules are enabled, compare UDP: sent packets and TCP: sent packets with the configured Packets per Second budget. This verifies that load was distributed among the selected modules as expected.
GRE Flood
Total GRE is the aggregate dashboard; GRE provides details.
| Metric | Description |
|---|---|
| gre.tx.packets / gre.rx.packets | Sent/received GRE packets |
| gre.tx.bytes / gre.rx.bytes | TX/RX GRE data volume |
DNS Flood
Total DNS Flood is the aggregate dashboard; DNS Flood provides details.
| Metric | Description |
|---|---|
| dns_flood.tx.packets / dns_flood.rx.packets | Sent/received DNS Flood packets |
| dns_flood.tx.bytes / dns_flood.rx.bytes | TX/RX DNS Flood data volume |
ICMP / Ping / Fragmentation / Amplification
| Dashboard key | Plugin |
|---|---|
ddos_icmp_flood | ICMP Flood (103) |
ddos_icmp_fragmentation | ICMP Fragmentation Flood (104) |
ddos_ping_flood | Ping Flood (105) |
ddos_ping_of_death | Ping of Death Flood (106) |
ddos_dns_amplification | DNS Amplification UDP (107) |
ddos_udp_fragmentation | UDP Fragmentation Flood (108) |
ddos_ntp_amplification | NTP Amplification UDP (110) |
Compromised Host
The compromised_host dashboard shows directed C2 attempts, completed and blocked scenarios, timeouts, early TCP closes, response mismatches, and separate replay errors.
DHCP Flood (Legacy)
Total DHCP Flood is the aggregate dashboard; DHCP Flood provides details.
| Metric | Description |
|---|---|
| dhcp_flood.tx.packets / dhcp_flood.rx.packets | Sent/received DHCP Flood packets |
| dhcp_flood.tx.bytes / dhcp_flood.rx.bytes | TX/RX DHCP Flood data volume |
WAF
The WAF dashboard shows Web Application Firewall test results: requests sent in each attack category.
| Metric group | Description |
|---|---|
| waf.broken_access_control, waf.injection.*, waf.xss.*, waf.ssrf, and others | Basic test: one metric per attack type (18 categories) |
| waf.sqli.* | SQLi Advanced: 50 SQL injection types |
| waf.xxe.* | XXE Advanced: four XML parser attack types |
| waf.cmdi.* | Command Injection Advanced: 18 OS command types |
| waf.fi.* | File Injection Advanced: eight file-inclusion types |
| waf.pt.* | Path Traversal Advanced: 17 traversal types |
| waf.unc.* | UNC Path: four UNC-path attack types |
| waf.rce.* | RCE Advanced: six remote-code-execution types |
| waf.xss.* (advanced) | XSS Advanced: 19 cross-site scripting types |
| waf.ssrf.* (advanced) | SSRF Advanced: 19 server-side request forgery types |
| waf.ssti.* | SSI/SSTI Advanced: seven server-side template injection types |
| waf.graphql.* | GraphQL: two schema attack types |
DNS
Total DNS aggregates all DNS plugins. Separate dashboards are available for DNS over UDP, DNS over TCP, DNS over TLS, and DNS over HTTP.
| Metric | Description |
|---|---|
| dns.tx.queries / dns.rx.responses | Sent queries / received responses |
| dns.tx.bytes / dns.rx.bytes | TX/RX DNS data volume |
| dns.rx.rcode.ok | NOERROR responses |
| dns.rx.rcode.format_error | FORMERR responses |
| dns.rx.rcode.server_failure | SERVFAIL responses |
| dns.rx.rcode.name_error | NXDOMAIN responses |
| dns.rx.rcode.not_implemented | NOTIMP responses |
| dns.rx.rcode.refused | REFUSED responses |
| dns.rx.flags.aa/tc/rd/ra | DNS response flags: Authoritative, Truncated, Recursion Desired/Available |
| dns.tls_1_2.* / dns.tls_1_3.* | DNS-over-TLS metrics by TLS version: packets, bytes, and CC |
MHDDoS Emulation
The MHDDoS dashboard combines metrics for all active subplugins (SYN Flood, UDP Flood, GRE Flood, STRESS, and more) in one MHDDoS task.
PCAP Replay and Dynamic Applications
Dedicated dashboards for replaying real traffic compare sent and received volume, replay rate, and session state.
| Metric group | Description |
|---|---|
| PCAP Replay Stateless | Packets, bytes, and replay rate of raw PCAP packets |
| PCAP Replay Stateful | Sessions, packets, bytes, and replay rate of selected TCP/UDP sessions |
| Applications | Active users, started/completed flows, failed flows, and total traffic volume |
CVE Replay and File Transfer
The CVE dashboard is selected automatically from the combination of mode (attack/FP) and coverage (first/all scenarios): cve_replay, cve_replay_all, cve_replay_fp, or cve_replay_fp_all. Outcome semantics (completed, blocked_rst, blocked_syn, blocked_timeout, blocked_close, payload_mismatch, and blocked_orphan) are described under Network Vulnerabilities (CVE).
| Metric group | Description |
|---|---|
| CVE Replay | Replay attempts and outcomes: completed, RST/SYN, timeout, early close, response mismatch, and replay error |
| File Transfer | Requests, responses, transferred file volume, and transfer latency |
| Malware File Transfer | Transferred PTI files, receiver responses, and security-system inspection results |
RoCEv2, Elephant Flow, and L2 Convergence
| Metric group | Description |
|---|---|
| RoCEv2 | RoCEv2 packets, bytes, rate, and congestion events |
| Elephant Flow TCP | Long-lived TCP flows, data volume, rate, and session state |
| Elephant Flow UDP | Long-lived UDP flows, packets, bytes, and rate |
| L2 Convergence UDP | Loss, flow recovery, and convergence-time calculation |
IPsec
For IPsec scenarios, use the general traffic dashboards and specialized tunnel panels. Performance results for bulk IPsec scenarios are published under Benchmarks.
| Metric group | Description |
|---|---|
| Active tunnels | Current established IPsec tunnel count |
| Tunnel establishment | Tunnel creation over time |
| Traffic through IPsec | Packets, bytes, and rate within tunnels |
| Errors and events | Establishment errors, disconnects, and tunnel-scenario diagnostic events |
Dual Mode (Client + Server)
When client and server plugins run together, Dual dashboards combine metrics from both sides:
| Dashboard | Description |
|---|---|
| Total Dual | General client and server metrics |
| Total HTTP/TLS Dual | Combined client + server HTTP/TLS aggregate |
| HTTP/TLS Dual | Combined client + server HTTP/TLS details |
Service Metrics
Additional metrics on general dashboards:
| Metric | Description |
|---|---|
| arp.rx/tx.packets, arp.rx/tx.bytes | Automatic ARP traffic used to resolve MAC addresses |
| icmp.rx/tx.packets, icmp.rx/tx.bytes | ICMP traffic, including automatic ping replies |
| kni.rx/tx.packets, kni.rx/tx.bytes | Traffic through the KNI interface, redirected to the OS kernel |
| other.rx | Other received packets unrelated to plugins |